
Page 16 - Islands Business May-June 2022
P. 16
distributing around the world as strategic aid and investment.
Readers might well ask, what guarantee is there that these trends will
continue over the next 30 years? Of course, there are none. Disasters can happen
to any economy. But one indicator that economists can use is the percentage of
national income that a country saves and invests for the future.
I remind readers that any household that saves more and invests more, will
normally lead to higher incomes in the future. Consumerist households that
consume more of their income and save less, are not likely to grow their incomes
as fast into the future.
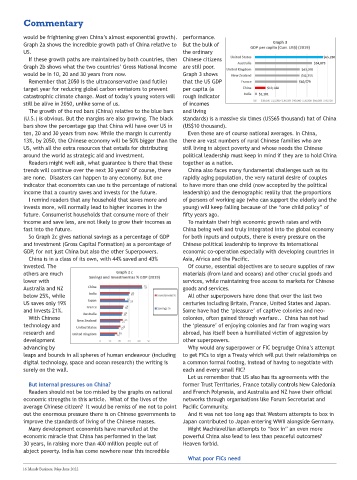
So Graph 2c gives national savings as a percentage of GDP and investment
(Gross Capital Formation) as a percentage of GDP, for not just China but also the
other Superpowers.
China is in a class of its own, with 44% saved and 43% invested. The others
are much lower with Australia and NZ below 25%, while US saves only 19% and
invests 21%.
With Chinese technology and research and development advancing by
Commentary leaps and bounds in all spheres of human endeavour (including digital Commentary
technology, space and ocean research) the writing is surely on the wall.
But internal pressures on China?
would be frightening given China’s almost exponential growth). performance.
instance as measured by Gross Readers should not be too
Graph 2a shows the incredible growth path of China relative to But the bulk of
National Income (Purchasing Power misled by the graphs on
Parity) in international dollars national economic strengths in
the ordinary
US.
(billions). this article. What of the lives
of the average Chinese citizen?
The GNI If these growth paths are maintained by both countries, then Chinese citizens
of
other
superpowers (France and UK) are a It would be remiss of me not
Graph 2b shows what the two countries’ Gross National Income are still poor.
mere fraction of China, with to point out the enormous
Australia being just 6% of China’s pressure there is on Chinese
Graph 3 shows
would be in 10, 20 and 30 years from now.
GNI. All developed countries governments to improve the
standards of living of the
that the US GDP
Remember that 2050 is the ultraconservative (and futile)
struggle to maintain their aid Chinese masses.
budgets, especially when their own Many per capita (a
development
target year for reducing global carbon emissions to prevent
economies are in trouble, for economists have marvelled at
whatever reason. catastrophic climate change. Most of today’s young voters will rough indicator
the economic miracle that
Just as important in terms of China has performed in the
of incomes
still be alive in 2050, unlike some of us.
giving foreign aid are the Foreign last 30 years, in raising more
Reserves of the superpowers. than 400 million people out of abject poverty. India has come nowhere near this
The growth of the red bars (China) relative to the blue bars
and living
incredible performance. But the bulk of the ordinary Chinese citizens are still poor.
Graph 1b shows the incredible strength that China has in its foreign reserves
Graph 3 shows that the US GDP per capita (a rough indicator of incomes and
(including gold). (U.S.) is obvious. But the margins are also growing. The black standards) is a massive six times (US$65 thousand) hat of China
living standards) is a massive six times (US$65 thousand) hat of China (US$10
The United States has just over one quarter of China’s Foreign Reserves.
bars show the percentage gap that China will have over US in
Australia has a mere 2% of China’s thousand). (US$10 thousand).
Even these are of course national averages. In China, there are vast
reserves. ten, 20 and 30 years from now. While the margin is currently Even these are of course national averages. In China,
numbers of rural Chinese families who are still living in abject poverty and whose
This relativity has existed for needs the Chinese political leadership must keep in mind if they are to hold China
13%, by 2050, the Chinese economy will be 50% bigger than the there are vast numbers of rural Chinese families who are
more than 15 years. How quickly together as a nation.
western superpowers have China also faces many fundamental challenges such as its rapidly aging
still living in abject poverty and whose needs the Chinese
US, with all the extra resources that entails for distributing
forgotten that it was China and its population, the very natural desire of couples to have more than one child (now
foreign reserves that saved the accepted by the political leadership) and the demographic reality that the
around the world as strategic aid and investment.
political leadership must keep in mind if they are to hold China
west from the Global Financial proportions of persons of working age (who can support the elderly and the
young) will keep falling because of the “one child policy” of fifty years ago.
Crisis. Readers might well ask, what guarantee is there that these together as a nation.
To maintain their high economic growth rates and with China being well
trends will continue over the next 30 years? Of course, there China also faces many fundamental challenges such as its
Future Economic Strengths? and truly integrated into the global economy for both inputs and outputs, there is
every pressure on the Chinese political leadership to improve its international
are none. Disasters can happen to any economy. But one rapidly aging population, the very natural desire of couples
economic co-operation especially with developing countries in Asia, Africa and the
The previous two graphs indicate Pacific.
indicator that economists can use is the percentage of national to have more than one child (now accepted by the political
only the current relativities of Of course, essential objectives are to secure supplies of raw materials (from
economic strength. But what does land leadership) and the demographic reality that the proportions
income that a country saves and invests for the future. and oceans) and other crucial goods and services, while maintaining free
the future hold? The trends are access to markets for Chinese goods and services.
of persons of working age (who can support the elderly and the
I remind readers that any household that saves more and All other superpowers have done that over the last two centuries including
astonishing. I just go back to 2004,
young) will keep falling because of the “one child policy” of
invests more, will normally lead to higher incomes in the
so as to have a rough linear trend Britain, France, United States and Japan. Some have had the ‘pleasure’ of captive
(to go back further would be colonies and neo-colonies, often gained through warfare.. China has not had the
fifty years ago.
future. Consumerist households that consume more of their
frightening given China’s almost ‘pleasure’ of enjoying colonies and far from waging wars abroad, has itself been a
humiliated victim of aggression by other superpowers.
exponential growth). Graph 2a To maintain their high economic growth rates and with
income and save less, are not likely to grow their incomes as
shows the incredible growth path of
fast into the future.
China relative to US. China being well and truly integrated into the global economy
If these growth paths are
So Graph 2c gives national savings as a percentage of GDP
maintained by both countries, then for both inputs and outputs, there is every pressure on the
Graph 2b shows what the two Chinese political leadership to improve its international
and investment (Gross Capital Formation) as a percentage of
countries’ Gross National Income
GDP, for not just China but also the other Superpowers.
would be in 10, 20 and 30 years economic co-operation especially with developing countries in
from now. China is in a class of its own, with 44% saved and 43% Asia, Africa and the Pacific.
Remember that 2050 is the
invested. The
ultraconservative (and futile) target Of course, essential objectives are to secure supplies of raw
year for reducing global carbon
others are much
emissions to prevent catastrophic materials (from land and oceans) and other crucial goods and
climate change. Most of today’s services, while maintaining free access to markets for Chinese
lower with
young voters will still be alive in
Australia and NZ
2050, unlike some of us. goods and services.
The growth of the red bars
below 25%, while
(China) relative to the blue bars All other superpowers have done that over the last two
(U.S.) is obvious. But the margins centuries including Britain, France, United States and Japan.
US saves only 19%
are also growing. The black bars
and invests 21%.
show the percentage gap that China Some have had the ‘pleasure’ of captive colonies and neo-
will have over US in ten, 20 and 30 colonies, often gained through warfare.. China has not had
With Chinese
years from now. While the margin
technology and
is currently 13%, by 2050, the the ‘pleasure’ of enjoying colonies and far from waging wars
Chinese economy will be 50%
research and
bigger than the US, with all the abroad, has itself been a humiliated victim of aggression by
extra resources that entails for other superpowers.
development
advancing by Why would any superpower or FIC begrudge China’s attempt
leaps and bounds in all spheres of human endeavour (including to get FICs to sign a Treaty which will put their relationships on
digital technology, space and ocean research) the writing is a common formal footing, instead of having to negotiate with
surely on the wall. each and every small FIC?
Let us remember that US also has its agreements with the
But internal pressures on China? former Trust Territories, France totally controls New Caledonia
Readers should not be too misled by the graphs on national and French Polynesia, and Australia and NZ have their official
economic strengths in this article. What of the lives of the networks through organisations like Forum Secretariat and
average Chinese citizen? It would be remiss of me not to point Pacific Community.
out the enormous pressure there is on Chinese governments to And it was not too long ago that Western attempts to box in
improve the standards of living of the Chinese masses. Japan contributed to Japan entering WWII alongside Germany.
Many development economists have marvelled at the Might Machiavellian attempts to “box in” an even more
economic miracle that China has performed in the last powerful China also lead to less than peaceful outcomes?
30 years, in raising more than 400 million people out of Heaven forbid.
abject poverty. India has come nowhere near this incredible
What poor FICs need
16 Islands Business, May-June 2022