
Page 15 - Islands Business May-June 2022
P. 15
Commentary
THE FALSE PACIFIC DILEMMA OF
CHOOSING BETWEEN U.S. AND CHINA
By Dr Wadan Narsey the relativity of one superpower to another does not change
significantly if different criteria are used.
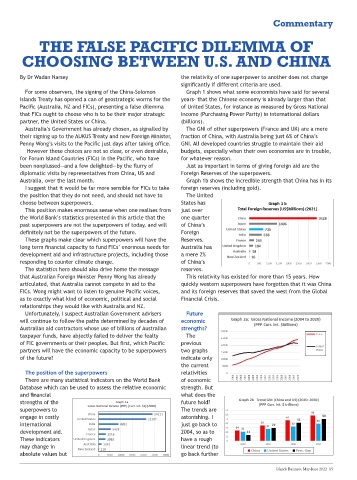
For some observers, the signing of the China-Solomon Graph 1 shows what some economists have said for several
Islands Treaty has opened a can of geostrategic worms for the years- that the Chinese economy is already larger than that
Pacific (Australia, NZ and FICs), presenting a false dilemma of United States, for instance as measured by Gross National
that FICs ought to choose who is to be their major strategic Income (Purchasing Power Parity) in international dollars
partner, the United States or China. (billions).
Australia’s Government has already chosen, as signalled by The GNI of other superpowers (France and UK) are a mere
their signing up to the AUKUS Treaty and new Foreign Minister, fraction of China, with Australia being just 6% of China’s
Penny Wong’s visits to the Pacific just days after taking office. GNI. All developed countries struggle to maintain their aid
However these choices are not so clear, or even desirable, budgets, especially when their own economies are in trouble,
for Forum Island Countries (FICs) in the Pacific, who have for whatever reason.
been nonplussed—and a few delighted—by the flurry of Just as important in terms of giving foreign aid are the
diplomatic visits by representatives from China, US and Foreign Reserves of the superpowers.
Australia, over the last month. Graph 1b shows the incredible strength that China has in its
I suggest that it would be far more sensible for FICs to take foreign reserves (including gold).
the position that they do not need, and should not have to The United
choose between superpowers. instance as measured by Gross
States has
National Income (Purchasing Power
This position makes enormous sense when one realises from
just over
ISSUE: May-June 2022 Parity) in international dollars
(billions).
one quarter
PAGE: 15-17 instance as measured by Gross
of
the World Bank’s statistics presented in this article that the GNI
The
other
SLUG: Commentary superpowers (France and UK) are a
past superpowers are not the superpowers of today, and will
National Income (Purchasing Power
of China’s
mere fraction of China, with
HED: The false Pacific dilemma of choosing between US and China
Parity) in international dollars
Australia being just 6% of China’s
SUBHED: definitely not be the superpowers of the future. Foreign
(billions).
instance as measured by Gross
All
These graphs make clear which superpowers will have the GNI
Reserves. other
National Income (Purchasing Power
BYLINE: Dr Wadan Narsey GNI. The developed of countries
superpowers (France and UK) are a
Parity) in international dollars
WORDCOUNT: 2080 struggle to maintain their aid
long term financial capacity to fund FICs’ enormous needs for
Australia has
budgets, especially when their own
(billions).
IMAGES: Graphs mere fraction of China, with
economies are in trouble, for
of
development aid and infrastructure projects, including those GNI
The
a mere 2% other
NOTES FOR DESIGNER: Australia being just 6% of China’s
whatever reason.
GNI. superpowers (France and UK) are a
countries
developed
All
Dick, the page needs to be laid out like this so the tables sit in the right place. There of China’s of
responding to counter climate change.
Just as important in terms
mere fraction of China, with
struggle to maintain their aid
giving foreign aid are the Foreign
will be some work to do in fixing justification/spacing at your end. Australia being just 6% of China’s
budgets, especially when their own
reserves.
The statistics here should also drive home the message
developed
GNI.
All
Reserves of the superpowers. countries
economies are in trouble, for
Graph 1b shows the incredible strength that China has in its foreign reserves
struggle to maintain their aid
that Australian Foreign Minister Penny Wong has already This relativity has existed for more than 15 years. How
whatever reason.
(including gold).
budgets, especially when their own
For some observers, the signing of the China-Solomon Islands Treaty has opened a quickly western superpowers have forgotten that it was China
Just as important in terms of
articulated, that Australia cannot compete in aid to the
economies are in trouble, for
The United States has just over one quarter of China’s Foreign Reserves.
can of geostrategic worms for the Pacific (Australia, NZ and FICs), presenting a
giving foreign aid are the Foreign
whatever reason.
Australia has a mere 2% of China’s
false dilemma that FICs ought to choose who is to be their major strategic partner, and its foreign reserves that saved the west from the Global
FICs. Wong might want to listen to genuine Pacific voices,
Reserves of the superpowers.
the United States or China. reserves. Just as important in terms of
Graph 1b shows the incredible strength that China has in its foreign reserves
Australia’s Government has already chosen, as signalled by their signing up Financial Crisis.
as to exactly what kind of economic, political and social
giving foreign aid are the Foreign
This relativity has existed for
(including gold).
to the AUKUS Treaty and new Foreign Minister, Penny Wong’s visits to the Pacific
Reserves of the superpowers.
just days after taking office. more than 15 years. How quickly
relationships they would like with Australia and NZ. The United States has just over one quarter of China’s Foreign Reserves.
Graph 1b shows the incredible strength that China has in its foreign reserves
superpowers
However these choices are not so clear, or even desirable, for Forum have
western
Australia has a mere 2% of China’s
(including gold).
Island Countries (FICs) in the Pacific, who have been nonplussed—and a few Future
Unfortunately, I suspect Australian Government advisers
forgotten that it was China and its
reserves. The United States has just over one quarter of China’s Foreign Reserves.
delighted—by the flurry of diplomatic visits by representatives from China, US and
economic
will continue to follow the paths determined by decades of
This relativity has existed for
Australia, over the last month. foreign reserves that saved the
Australia has a mere 2% of China’s
west from the Global Financial
I suggest that it would be far more sensible for FICs to take the position
more than 15 years. How quickly
reserves.
strengths?
Australian aid contractors whose use of billions of Australian
that they do not need, and should not have to choose between superpowers. superpowers have
Crisis.
western This relativity has existed for
This position makes enormous sense when one realises from the World
forgotten that it was China and its
Bank’s statistics presented in this article that the past superpowers are not 15 The
taxpayer funds, have abjectly failed to deliver the fealty the years. How quickly
more than
foreign reserves that saved the
superpowers of today, and will definitely not be the superpowers of the future. superpowers have
western
Future Economic Strengths?
of FIC governments or their peoples. But first, which Pacific
These graphs make clear which superpowers will have the long term previous
west from the Global Financial
forgotten that it was China and its
financial capacity to fund FICs’ enormous needs for development aid and
foreign reserves that saved the
Crisis.
infrastructure projects, including those responding to counter climate change. two graphs indicate
The previous
two graphs
partners will have the economic capacity to be superpowers
west from the Global Financial
only the current relativities of
The statistics here should also drive home the message that Australian
of the future?
Crisis.
economic strength. But what does
Foreign Minister Penny Wong has already articulated, that Australia cannot indicate only
Future Economic Strengths?
compete in aid to the FICs. Wong might want to listen to genuine Pacific voices, the current
the future hold? The trends are
as to exactly what kind of economic, political and social relationships they would
Future Economic Strengths?
The previous two graphs indicate
like with Australia and NZ. astonishing. I just go back to 2004,
The position of the superpowers
relativities
so as to have a rough linear trend
Unfortunately, I suspect Australian Government advisers will continue to
only the current relativities of
follow the paths determined by decades of Australian aid contractors whose use of two graphs indicate
The previous
(to go back further would be
There are many statistical indicators on the World Bank
of economic
economic strength. But what does
only the current relativities of
billions of Australian taxpayer funds, have abjectly failed to deliver the fealty of
frightening given China’s almost
the future hold? The trends are
FIC governments or their peoples. But first, which Pacific partners will have the strength. But
economic strength. But what does
Database which can be used to assess the relative economic
astonishing. I just go back to 2004,
economic capacity to be superpowers of the future? exponential growth). Graph 2a
the future hold? The trends are
and financial shows the incredible growth path of
so as to have a rough linear trend
what does the
astonishing. I just go back to 2004,
The position of the superpowers China relative to US.
(to go back further would be
so as to have a rough linear trend
future hold?
If these growth paths are
strengths of the frightening given China’s almost
(to go back further would be
There are many statistical maintained by both countries, then
exponential growth). Graph 2a
The trends are
frightening given China’s almost
indicators on the World Graph 2b shows what the two
superpowers to Bank
exponential growth). Graph 2a
Database which can be used to shows the incredible growth path of
engage in costly
astonishing. I
assess the relative economic and countries’ Gross National Income
China relative to US.
shows the incredible growth path of
financial strengths of the would be in 10, 20 and 30 years
If these growth paths are
China relative to US.
just go back to
superpowers to engage from now.
international in costly
If these growth paths are
international development aid. maintained by both countries, then
Remember that 2050 is the
2004, so as to
development aid.
maintained by both countries, then
These indicators may change in Graph 2b shows what the two
countries’ Gross National Income
absolute values but the relativity ultraconservative (and futile) target
Graph 2b shows what the two
have a rough
These indicators
of one superpower to another year for reducing global carbon
countries’ Gross National Income
would be in 10, 20 and 30 years
does not change significantly if emissions to prevent catastrophic
may change in
linear trend (to
would
from now. be in 10, 20 and 30 years
different criteria are used. climate change. Most of today’s
from now.
Graph 1 shows what some Remember that 2050 is the
go back further
absolute values but
Remember that 2050 is the
ultraconservative (and futile) target
economists have said for several young voters will still be alive in
2050, unlike some of us.
ultraconservative (and futile) target
years- that the Chinese economy is already larger than that of United States, for
year for reducing global carbon
year for reducing global carbon
The growth of the red bars
emissions to prevent catastrophic
emissions to prevent catastrophic
(China) relative to the blue bars Islands Business, May-June 2022 15
climate change. Most of today’s
climate change. Most of today’s
(U.S.) is obvious. But the margins
young voters will still be alive in
young voters will still be alive
are also growing. The black bars in
2050, unlike some of us.
2050, unlike some of us.
show the percentage gap that China
The growth of the red bars
The growth of the red bars
will have over US in ten, 20 and 30
(China) relative to the blue bars
(China) relative to the blue bars
years from now. While the margin
(U.S.) is obvious. But the margins
(U.S.) is obvious. But the margins
is currently 13%, by 2050, the
are also growing. The black bars
are also growing. The black bars
Chinese economy will be 50%
show the percentage gap that China
show the percentage gap that China
bigger than the US, with all the
will have over US in ten, 20 and 30
will have over US in ten, 20 and 30
extra resources that entails for
years from now. While the margin
years from now. While the margin
is currently 13%, by 2050, the
is currently 13%, by 2050, the
Chinese economy will be 50%
Chinese economy will be 50%
bigger than the US, with all the
bigger than the US, with all the
extra resources that entails for
extra resources that entails for